
CEMEX · UX/UI Design
Global Health& SafetyReport.
A reporting experience for exploring health and safety indicators, regional performance and incident data.
Organization: DMI
Role: UX Designer
Project: Global Health & Safety Report
Completed while working at DMI. Featured here as part of my professional experience; this was not a DesignBite client engagement.
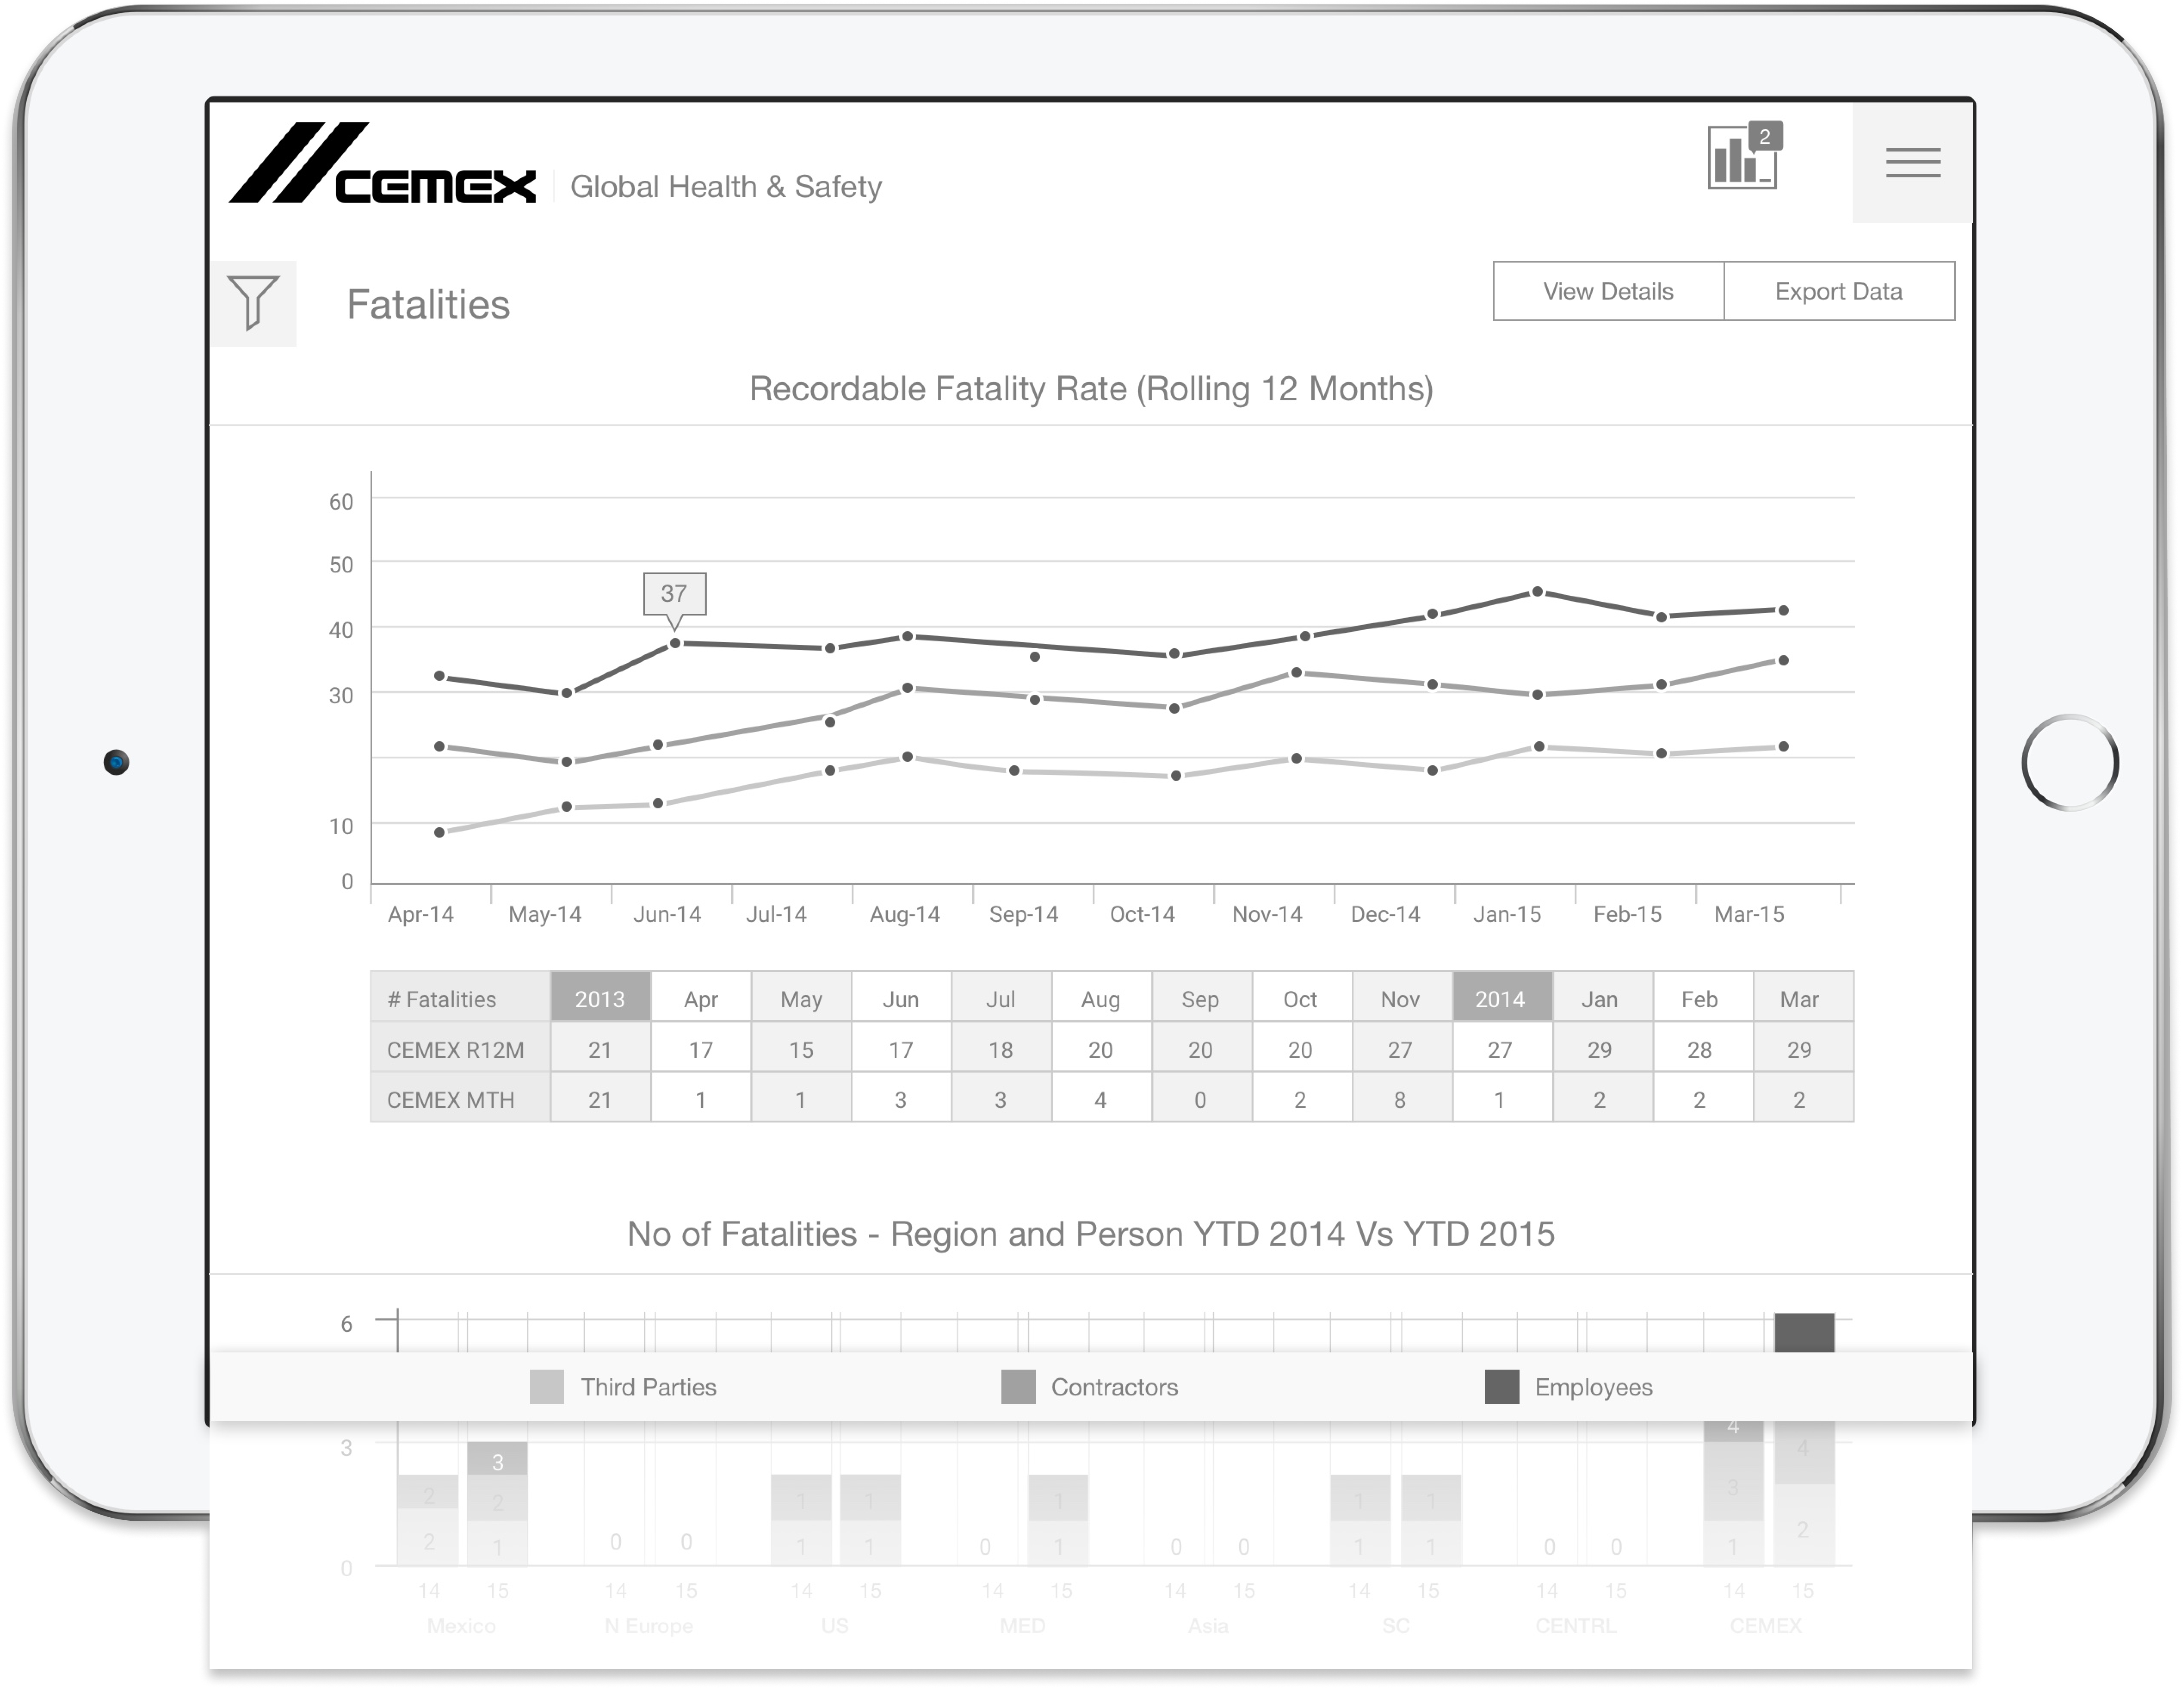
A tablet view of the Global Health & Safety reporting experience.
Making safety performance visible
Make safety
performance visible.
Turning complex global health and safety data into a reporting experience that helps people understand performance, compare regions and investigate incidents.
The report brings together multiple health and safety indicators across business sectors and geographies. Users need to understand overall performance, compare regions and explore specific incidents.
Understanding the reporting structure
Understand the
report structure.
The application map connects the dashboard overview to detailed views for individual indicators.
- Dashboard overview
- Detailed indicator views
- Filters by business sector, geography, time period, person type and event type
- Export options
- Notifications
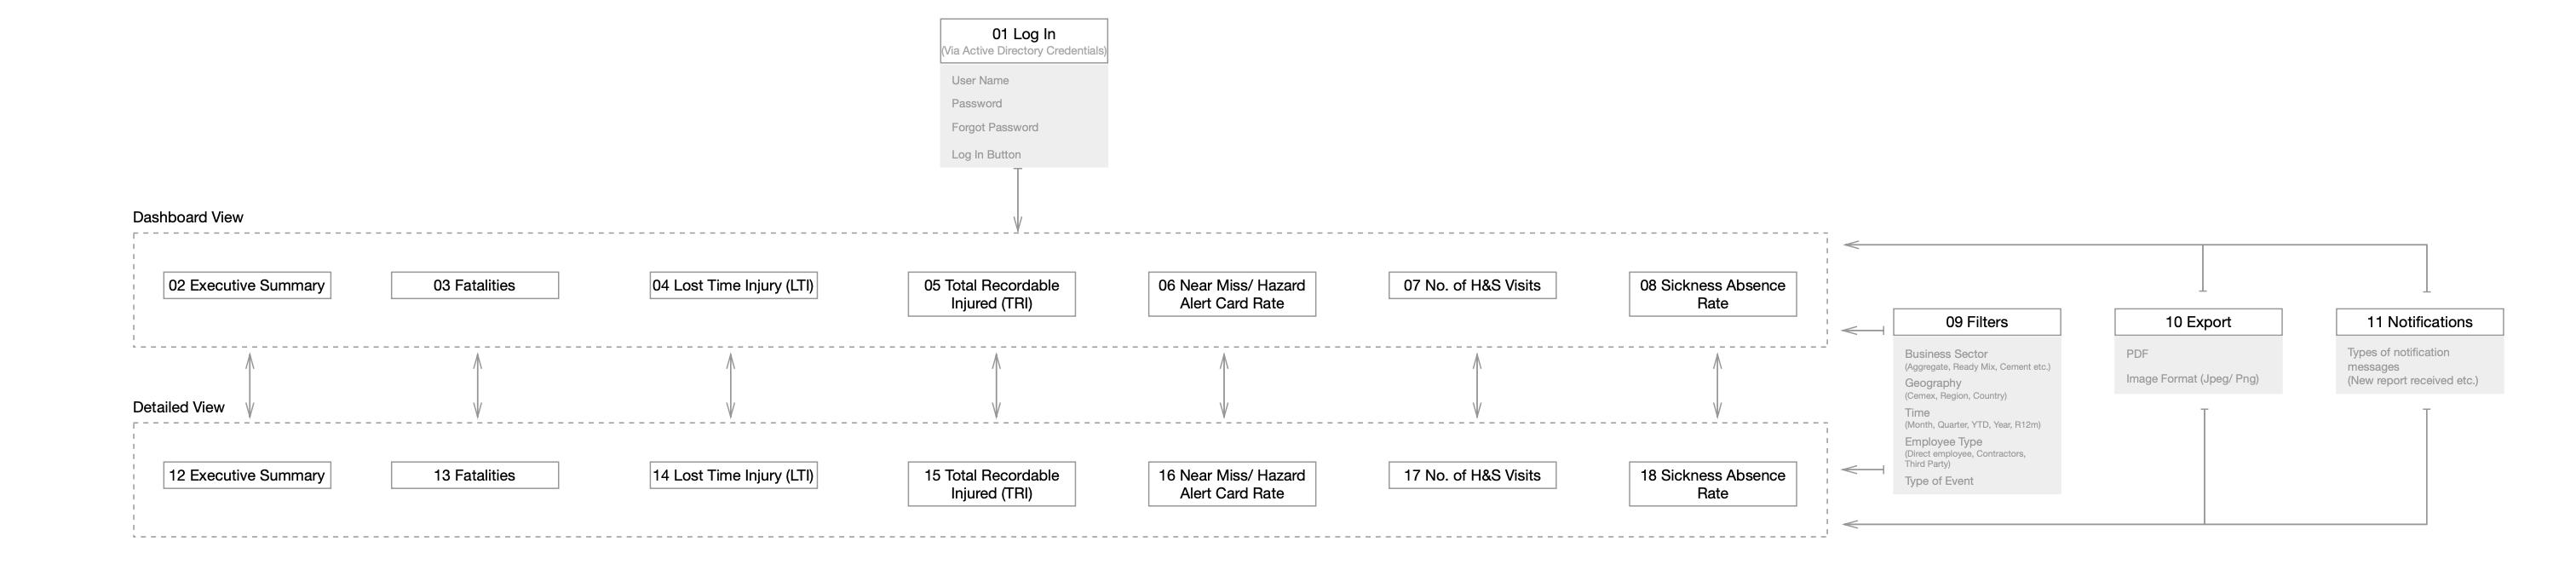
Product structure from dashboard overview to detailed reporting views.
From overview to investigation
Move from summary
to detail.
The reporting experience moves from an overview of indicators into detailed views and regional comparisons.
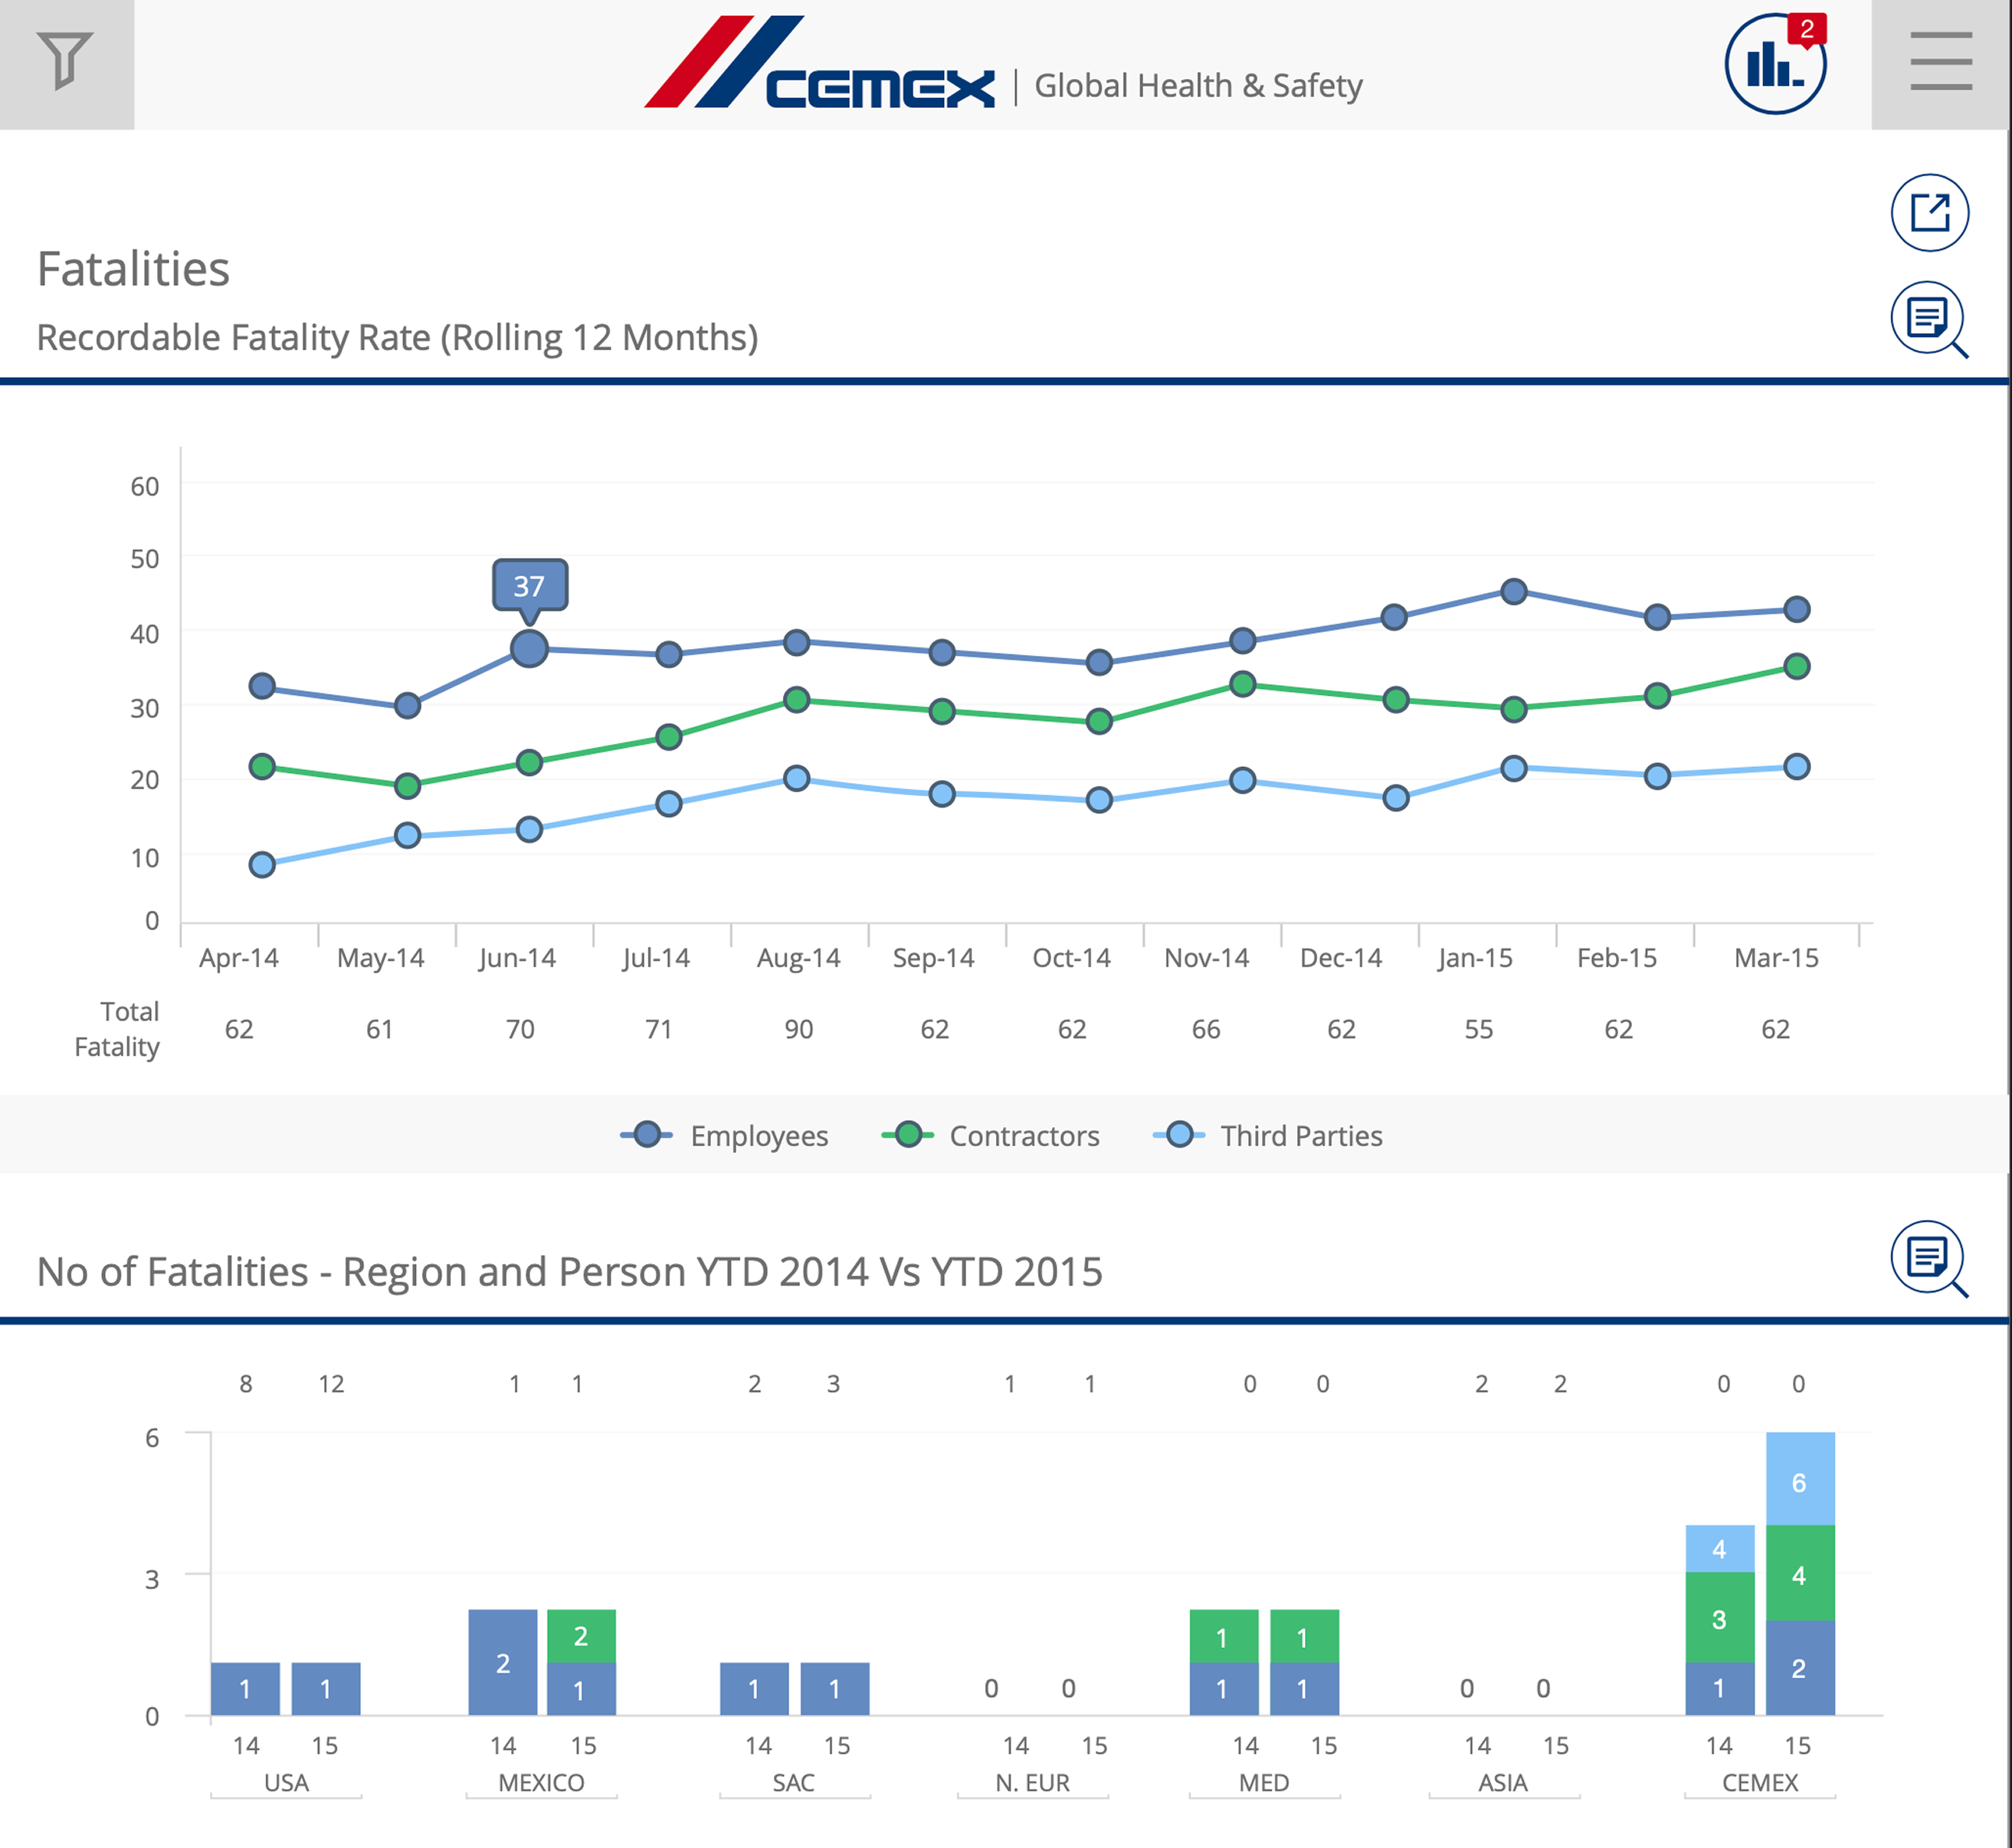
Fatality trends and detailed reporting views.
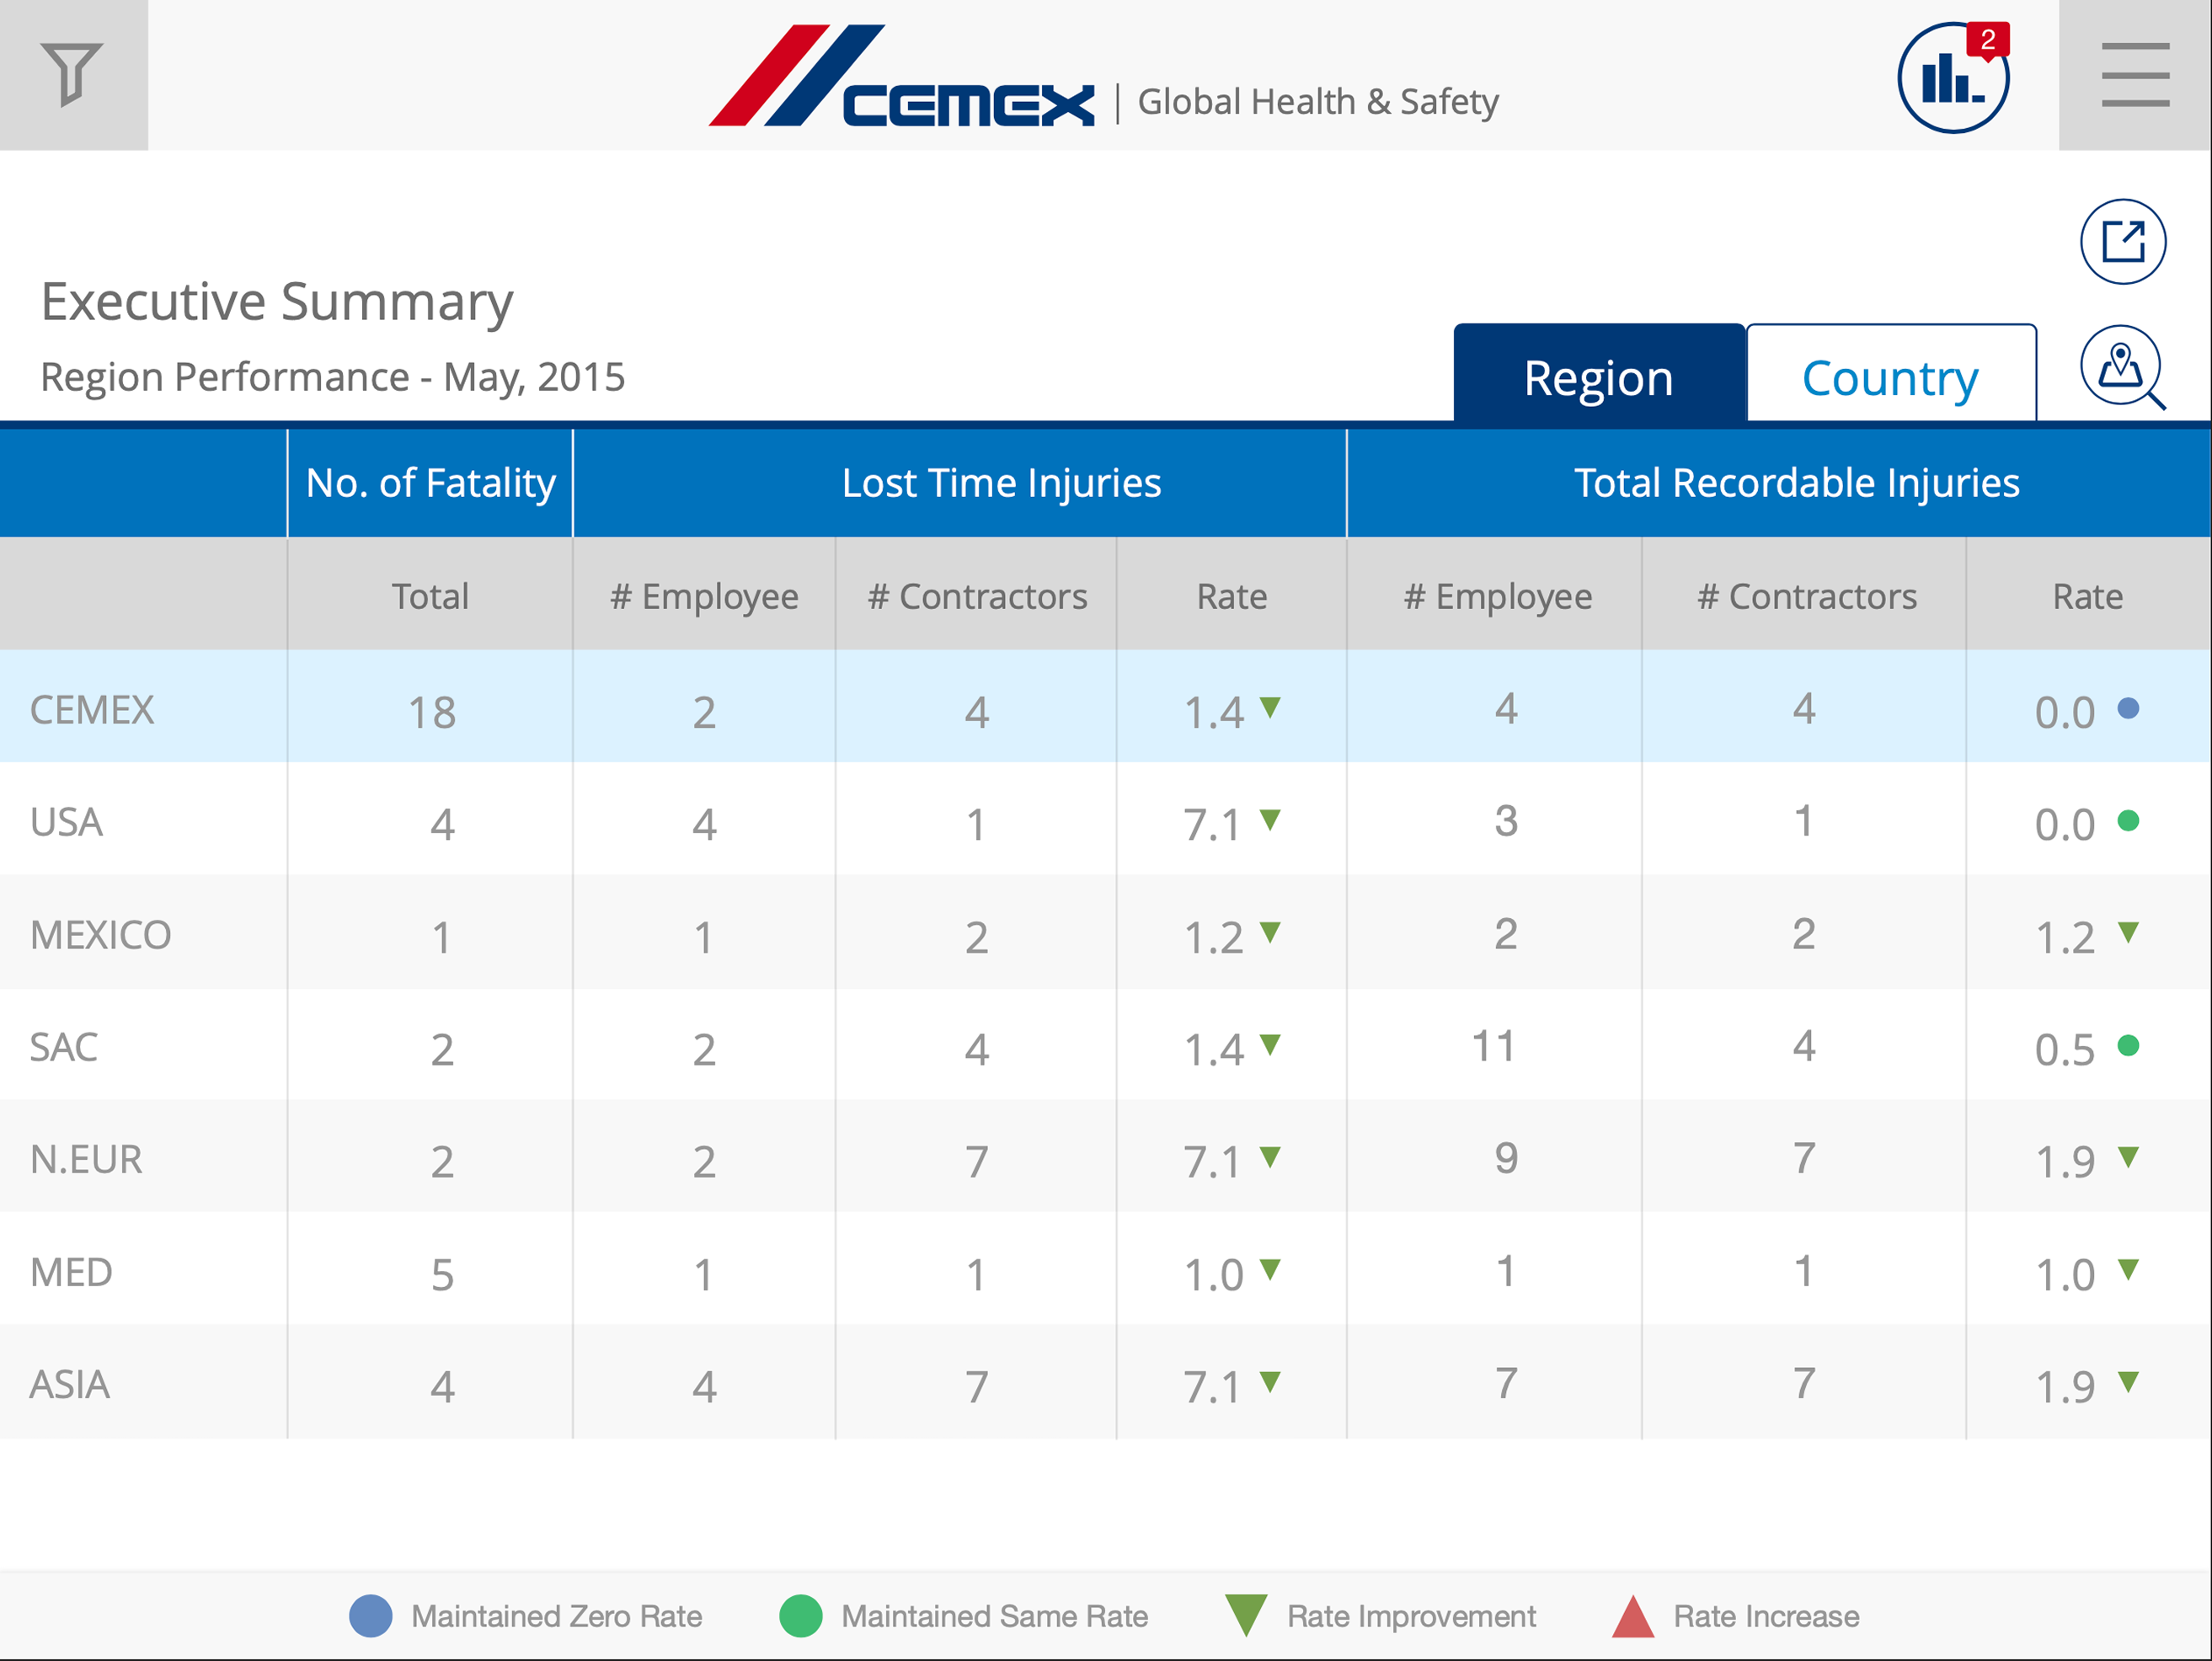
Regional performance in the executive summary.
Explore incidents in context
Explore incidents
in context.
Users can examine reported incidents in geographical context, with incident details and supporting information.
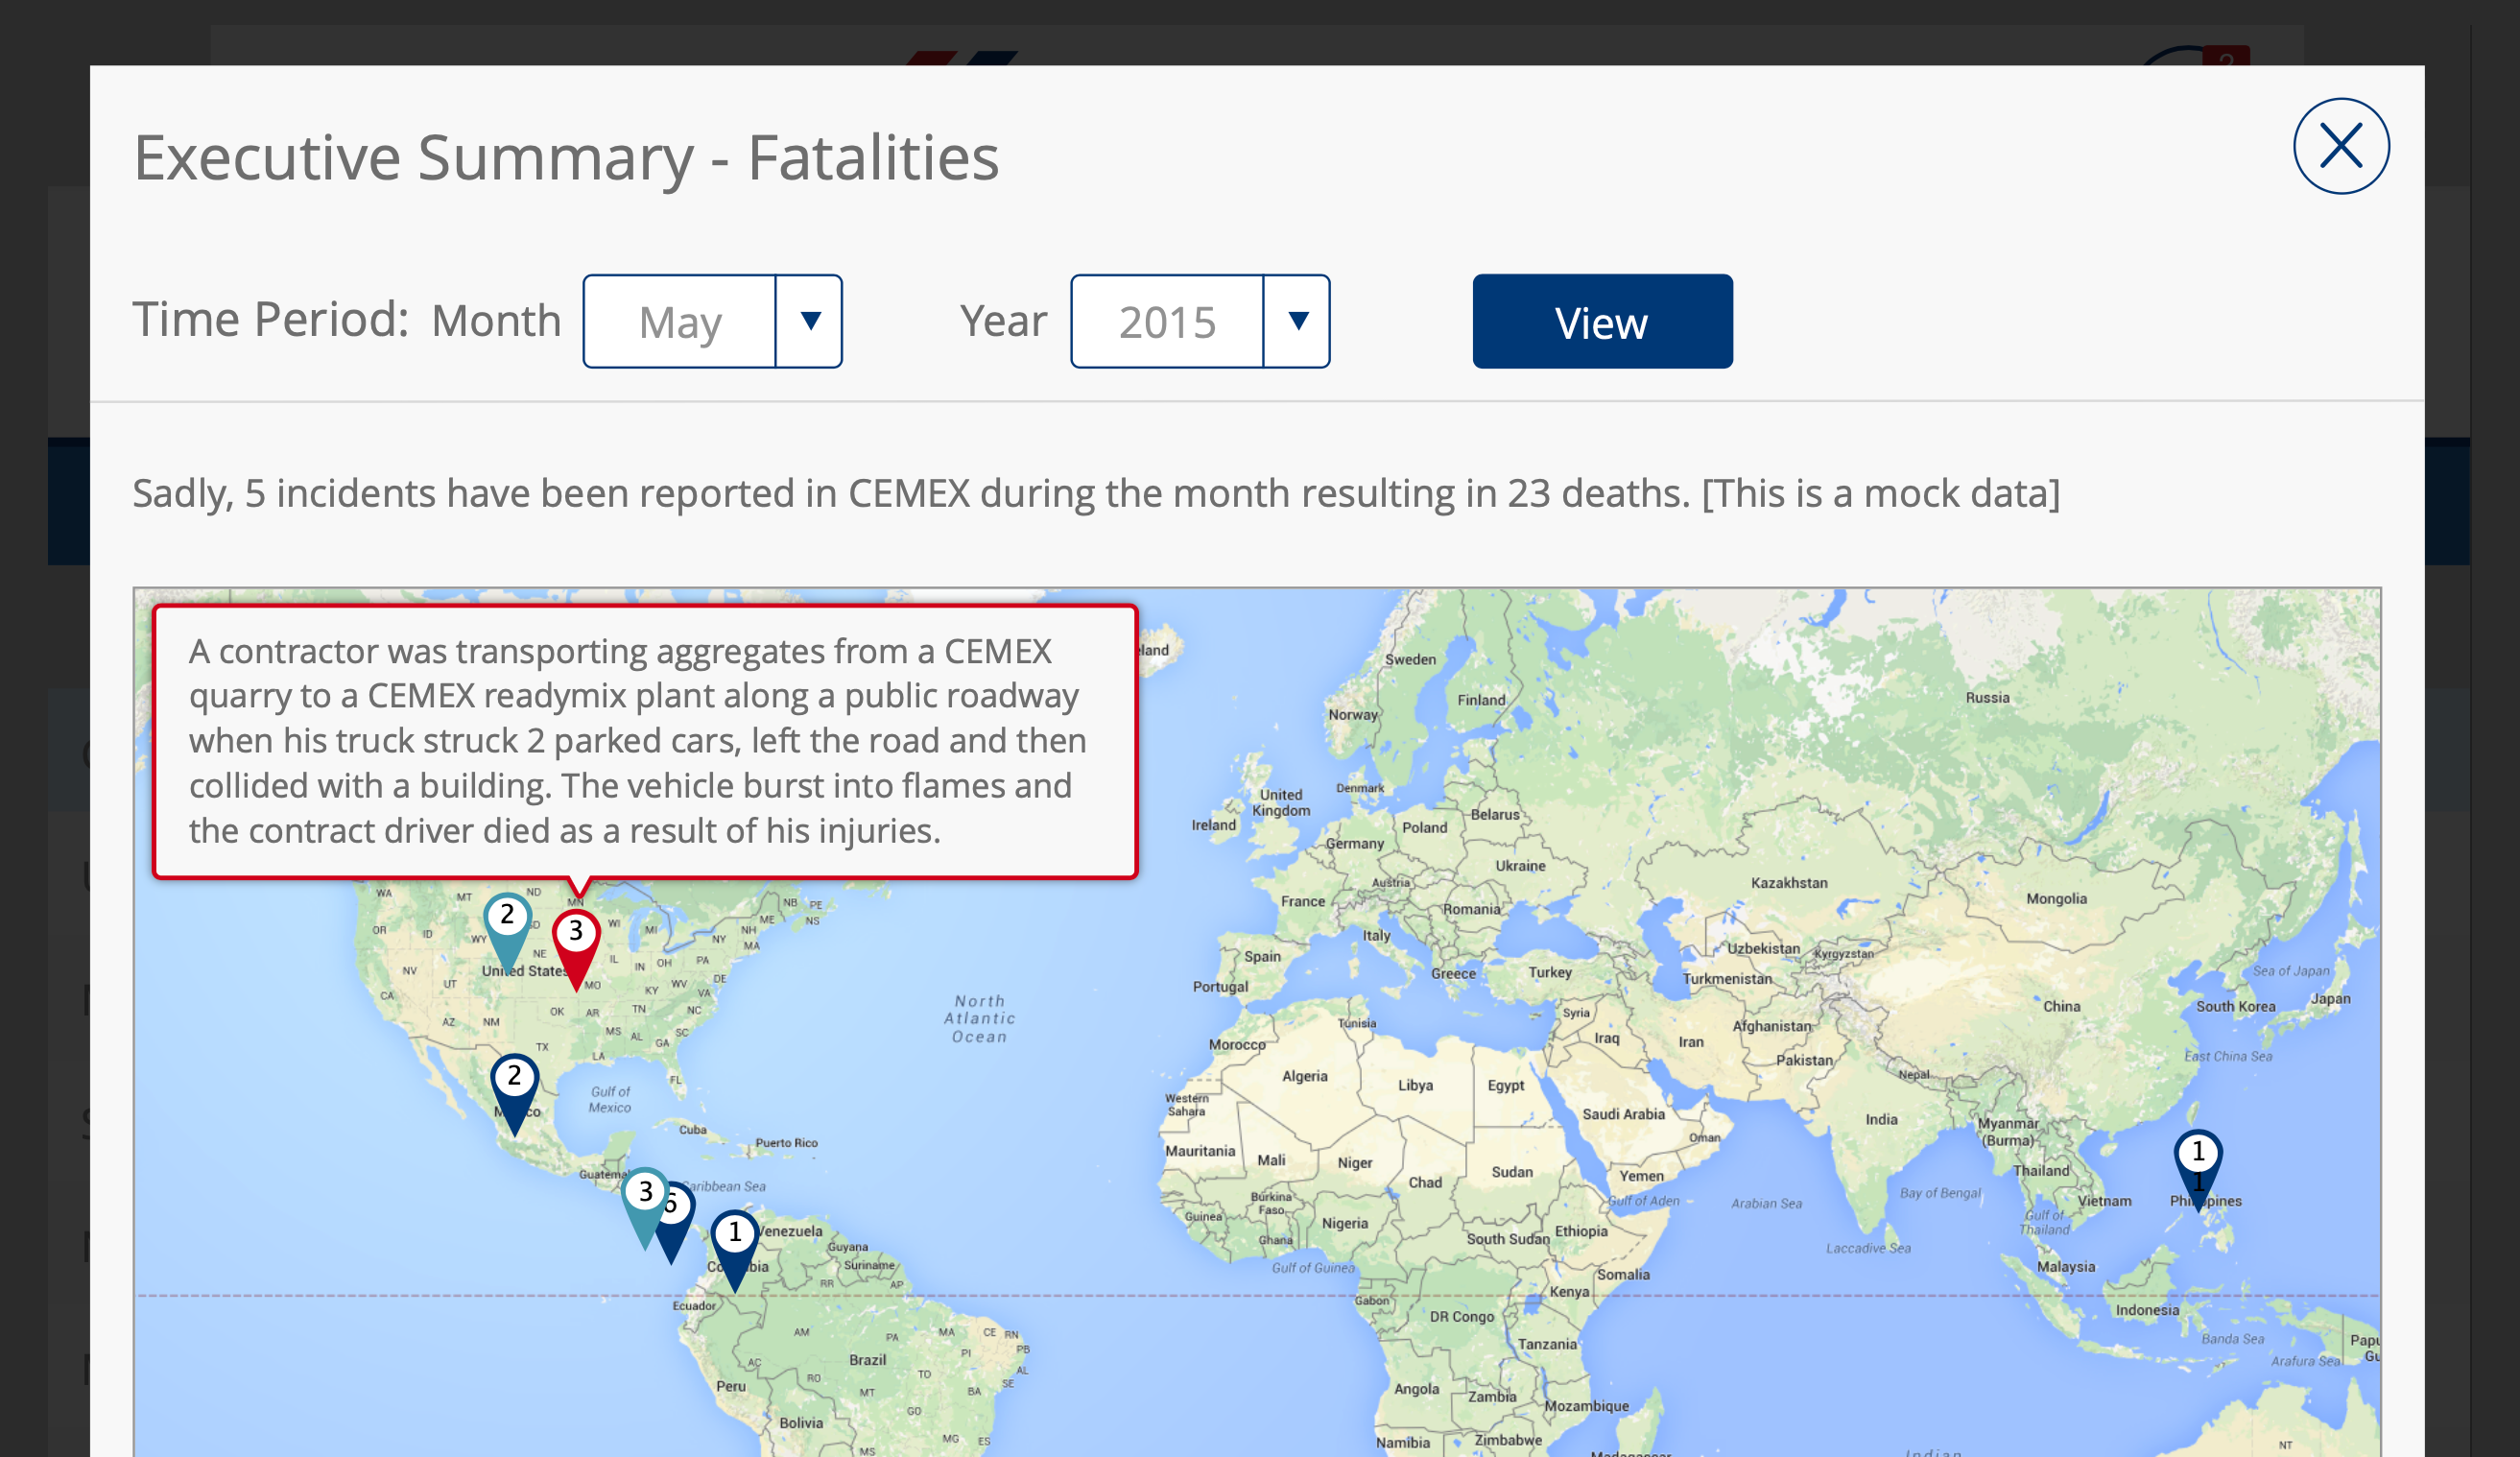
Reported incidents viewed in geographic context.
Designed for different screens
Support the report
across screens.
The project included responsive dashboard layouts and data tables. The iPad dashboard and detailed reporting views shown above represent different parts of the reporting experience without repeating the same screen.
A connected reporting experience
Connect the
reporting picture.
The experience brings together the report's core information and exploration needs:
- Global health and safety indicators
- Executive summaries and regional comparisons
- Detailed indicator views
- Filters and data exploration
- Incident investigation
- Export and notification capabilities